
Router and Adapter Testing Methodology
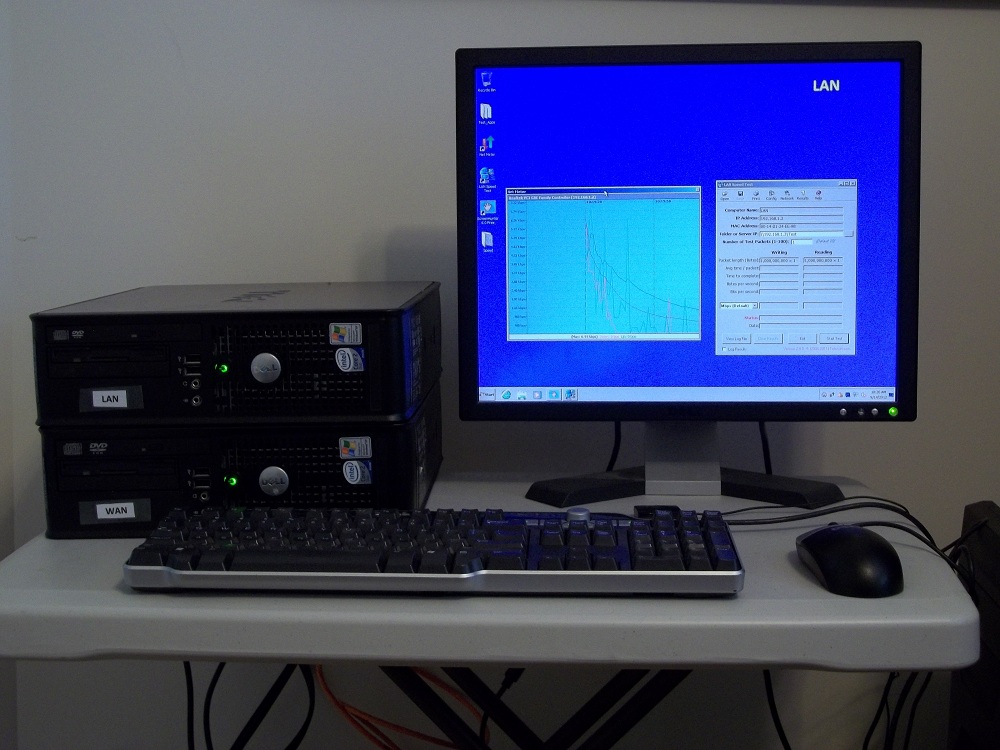
With our testing methodology we’ve strived to remove as many variables as possible from the equation and maintain consistency throughout multiple tests. We’re using two identical Dell Optiplex machines as the “WAN” and “LAN” networks with the following specifications:
- Core 2 Duo E6600 CPU (2.4 GHz)
- 2 GB (2 x 1 GB) Kingston HyperX DDR2 800 (PC2 6400) SDRAM
- Western Digital WD1600AAJS 160 GB HD (8 MB Cache/7200 RPM)
- Trendnet TEG-PCITXRL Low Profile Gigabit PCI Adapter
Both Dell machines are hooked up to a keyboard, mouse and 20” LCD using a Syba 2-Port USB KVM Switch. When needed, we use 2 foot CAT 6 network cables from monoprice.com.
As a baseline to compare both wired and wireless connectivity, we’re using the Fifth Generation Apple Airport Extreme Base Station (A1408). This little box from Apple has Gigabit WAN (1) and LAN (3) ports as well as 3×3:3 simultaneous dual band 802.11 a/b/g/n wireless that should theoretically be able to achieve speeds of up to 450 Mbps. Though Apple, unlike most other vendors, is smart enough not to flaunt this number in their marketing, as it’s unlikely end users will be able to achieve it.

To test PCI Express network adapters, there is a pair of open PCI Express slot in each of the Optiplex machines to network cards into. On the other hand, for USB based adapters, we’ll do all our testing with a laptop. By using a laptop for USB adapter testing we gain the ability to test not only from our “Lab” where the Optiplex machines are located, but also from other locations to simulate some real use test cases. For the laptop testing I’m using a MSI laptop with the following specifications:
- Core 2 Duo P7350 (2.0 GHz) CPU
- 4 GB (2 x 2 GB) Corsair DDR2/800 SODIMM RAM
- Kingston SSDNow V+ 100 96 GB SSD (SVP100S2/96G)
- ATI Mobility Radeon HD4670 (512 MB VRam)
- Intel Centrino Ultimate N 802.11n (draft) Wi-Fi Adapter (633ANHMW)
The MSI EX625 came with a built in 802.11 b/g/n adapter, but we’ve upgraded the internal Wi-Fi adapter to the Centrino Ultimate N as it’s one of the better mini PCI Express adapters on the market that might be found in a laptop. With 3×3:3 triple streams and advertised speeds up to 450 Mbps it’ll be perfect to use as a baseline to test router Wi-Fi speeds as well comparisons to other USB based Wi-Fi adapters.
Both the Dell Optiplex machines and the MSI EX625 laptops are running Windows 7 Professional that is kept at the same patch level, with all critical updates installed. Anti-Virus is not running or installed on any of the machines to remove any lag introduced into speed tests from the AV scanning file read/writes.

Hardware is only half the equation and we still need a way to actually measure network throughput and other important statistics for the various routers and adapters. Using this data we can consistently compare and contrast them against each other. While there are simple online speed tests, there are just too many variables that could impact those tests. For consistency sake, the machines will not be connected to the Internet at all and only networked with the test routers and each other. There are three pieces of software that I’ve wrapped up in a batch file to give us a good overall picture of network performance.
The first tool we use is a simple DOS based application contributed by Matrix21 over on Smallnetbuilder.com, aptly named, “Max_session_tool.” The Max Session Tool will open up UDP connections between two hosts until the receiving end starts to drop the packets. This will tell us the maximum number of network sessions that can be maintained between the LAN and WAN machine and give us an idea of how well the router can handle multiple sessions. Since this test mainly tests a router’s capability to open and maintain sessions, we will only run this test for the wired tests through a router.

Next up is the ever useful ping utility test. Anyone that’s done even basic network troubleshooting will be familiar with the ping command that is used to check connections between two machines. This simple tool will test the reachability of a host on the network and measure round trip time for messages sent from the host to the destination machine. With this simple tool we can gather the minimum, maximum and average time needed to send a packet of data between the two machine machines (and through the network router/adapter we are testing), as well as let us know if there are any packets dropped in the process.

Our final “tool” is actually a pair of great applications from Pete over at Totusoft. We are using Totusoft’s LAN Speed Test (v3) paired with their LST Server software to obtain data throughput speeds between our LAN and WAN machines. We could have just used LAN Speed Test to run file upload/downloads against a file share between the machines to gather Average, Minimum and Maximum Upload/Download speeds. However, adding the LST Server into the mix pushes the upload/download test data into the target system’s memory as opposed to hard disk. By doing this, we remove any impact the hard disk speeds/cache would have on the actual speed values. While there is a free ‘Lite’ version of the LAN Speed Test available, at only $5 each, both LAN Speed Test and LST server are worth every penny.

With these three tests we can get a pretty good snapshot of network connectivity and throughput. Initially I was manually running each test one at a time, but since there is such a large amount of tests that needs to be run, I strung together a batch file to automate each set of tests.

The batch file does the following:
- For routers, it will run the Max Sessions Tool 7 times and document the maximum sessions that can be opened between the LAN and WAN machine before they start being dropped.
- It will then run 7 tests of 100 pings each from the LAN to the WAN computer and document the Minimum, Maximum and Average ping time in addition to any dropped packets.
- Finally it will run 7 upload and download tests between the LAN and WAN machines using LAN Speed Test and the LST Server. Each LAN Speed test uploads and then downloads a 10 MB file 10 times in a row and then calculates Average, Minimum and Maximum Speeds in Mbps that were achieved while uploading and downloading the files.

Once all the tests have run, we transfer the data from the batch file logs over to a master spreadsheet. To minimize the impact of any extreme test results we drop the highest and lowest values for each test and then average the remaining ones for our ‘final’ test value for each metric.

Wireless testing requires a few extra test procedures over and above what we’ve already done. We will always test both 5 GHz and 2.4 GHz networks separately when the router/adapter has the capability to do so. Additionally, to ensure wireless testing is as consistent as possible across all our tests, we will always attempt to use the following Wireless networking settings on routers/adapters.
- Security: WPA2 Personal / AES
- 2.4 GHz Channel: 11
- 5 GHz Channel: 157
- Use Wide Channels/Channel Bandwidth: 40 Mhz
- Multicast Rate: Low
If a wireless adapter has more than one mode, say a “Standard” and a “High Power” mode, we’ll also run all the tests for each mode to see if there is any benefit to using one mode over the other.
Finally, since most people will likely not be sitting right next to their router when using USB based wireless adapters and a laptop, we will run all of our wireless tests in three different locations. For simplicity’s sake we are calling them the ‘Lab Test’, the ‘Normal Use Test’, and the ‘Torture Test’. In the ‘Lab Test’ I’ve set up both the router and Wi-Fi adapter in my office approximately 3 feet from each other. For the second ‘Normal Use Test’ the signal will have to travel half way across the house through two walls and a floor into the Living room about 45 feet away. Finally, we’ll wrap things up with a ‘Torture Test’ where the wireless signal has to travel 70 feet into my Laundry Room and punch through four walls, a floor, and everything in between. I don’t know what the builders lined the walls of the Laundry room with, but not only does it lay the smack down on most wireless signals, I think it would be usable as a nuclear bunker.

With all the testing methodology spelled out, let’s dive into the actual testing and see how well our test subjects perform.


Seems pretty good, especially
Seems pretty good, especially with the VPN server. I wish more companies would do that. I have only experienced unstable implementations of routers functioning as a VPN server using pptp and openvpn was more trouble than it was worth because of all of the command line needed and also there being no decent tutorial that did not require you to read like 20 pages and still not get it working.
I like having a VPN that is easy to use so I can quickly login from my laptop, or from a Linux live USB if on a public computer.
While openVPN is more secure than the older PPTP, no one has made a GUI front end where you can do a few clicks and then if gives you all of the various config texts to turn the router setup part into a copy and pasture job, and automate the client setup process as much as possible.
Also liked the router performance improvements, it seems that they optimized the firmware a bit better, hopefully those optimization make their way to the N66U
I’ve been using one of these
I’ve been using one of these for almost 2 years now (ever since my old D-Link DI-624 died) and have been extremely pleased with the performance of the router.
I’ve not had a single dropped WiFi connection (and I generally have at least an iPad and 2 iPhones connected any time I’m home, and occasionally a laptop or 2) and the LAN speeds have always been solid.
In most cases, I take an “if it ain’t broke, don’t fix it” approach to my routers. But seeing that they’ve done a complete UI overhaul with the newest firmware, I just have to go and upgrade it now.
That was really the only downside I found with the router. I couldn’t stand having to work through that old UI.
Great review and I also would highly recommend this router. I don’t think you can do any better for under ~$100.
I had a D-link gamerlounge
I had a D-link gamerlounge (DGL-4500), it had good specs to go along with the marketing 😉 , that I replaced with this when it had started to act up. I think it was running a Terraria server that pushed the D-Link over the edge.
This has held up much better than my D-link did, and was really impressed how well this performed without a myriad of antennas sticking out (my d-link had 3).
I have this router – I must
I have this router – I must upgrade the firmware as pcper did – and it just works. Plug it in and off you go. It is fast, reliable has good wireless range what more could you ask for
Only one problem with the design is that the Cat cables stick out so you will need to invest in a set of right angle connectors to preserve the clean look – if that is important to you.
Highly recommended
Have you tried the Padavan
Have you tried the Padavan firmware? Google for it.
There is a RT-N65U at the egg
There is a RT-N65U at the egg for the same price. Looks like an updated version with USB 3.0 and more range being the big difference.
Have lost my installation
Have lost my installation disc. Can anyone tell me have to get it on line ?
I have tried the new firmware
I have tried the new firmware and despit resetting/ rebooting etc, find it keeps dropping wireless connections. Have tried lots of different firmware for this over the last 16 months or so that alive owned it, including the Panamanian firmware, the only version to date that I’ve found reliable is 1.0.1.8f . All the rest are hopeless
Sorry about the typos. My
Sorry about the typos. My ipad autocorrects everything incorrectly. Meant Padavan firmware
Don’t need installation disc
Don’t need installation disc for asus router – just access via web browser at address 192.168.1.1. Can update firmware from here.
Also meant firmware version
Also meant firmware version 1.0.1.7f. Not 8f!
Currently using the firmware
Currently using the firmware that shipped with my router – V1.0.1.8j and working solidly so far. This is a replacement router as the first one I got kept spontaneously rebooting and intermittently unable to connect to internet via wifi. I had upgraded the first one with the latest f/w xxxx.318…don’t know if the upgraded firmware caused the problems, but I just returned for a new one through amazon.
Had this router for about 2
Had this router for about 2 weeks now. Updated to latest firmware and experienced the dropped connections I have read about. Just now downgrading to .7f. Haven’t put it back online yet (using old router currently), but I do not see the Parental Controls. Is this only in the latest firmware?
One thing, does it support
One thing, does it support more than one printer at the same time?
I would like to connect 2 or 3 printers (with a usb hub)?
I’ve been using it 2 weeks.
I’ve been using it 2 weeks. It arrived with the 1.0.1.8j I updated the firmware to 3.0.0.4.342 while I was setting it up. I’m running the media server, two wireless g 2.47 subnets through it as well as the n on 5. Plus using the VPN, usb for a hard drive share and a printer. No dropped wireless connections and the VPN has been solid.
Would you please share how to
Would you please share how to setup your vpn? I tried to setup VPN with my iphone 5, but unfortunately I always got the error ” A connection could not be established to the ppp server” no matter I am at home or office.
thanks,
Does any one have experience
Does any one have experience of using IPv6 in this router? I am planning to have one for IPv4 & IPv6 dual stack.
hey i just updated my
hey i just updated my firmware to the most recent 3.0.0.4.342. Love this router, but with the old firmware u were able to block mac address, i cant seem to figure out how to do it on the latest firmware… i have neighbours whos kid is living with us… ftw… n they mysteriously obtained our network key, its easier just to block them rather than have to go thru the whole proccess on setting everything back up with the new network key… someone please show me the light, much appreciated
Would you please share the
Would you please share the result of your matrix21 testing? From the above test, i cannot get the maximum session of the router.I tested the router with matrix21 and encountered the winsock error. I just wonder any method can help to avoid the winsock error. Thanks.