
Random Performance – Iometer (IOPS/latency), YAPT (random)
We are trying something different here. Folks tend to not like to click through pages and pages of benchmarks, so I'm going to weed out those that show little to no delta across different units (PCMark). I'm also going to group results performance trait tested. Here are the random access results:
Iometer:
Iometer is an I/O subsystem measurement and characterization tool for single and clustered systems. It was originally developed by the Intel Corporation and announced at the Intel Developers Forum (IDF) on February 17, 1998 – since then it got wide spread within the industry. Intel later discontinued work on Iometer and passed it onto the Open Source Development Lab (OSDL). In November 2001, code was dropped on SourceForge.net. Since the relaunch in February 2003, the project is driven by an international group of individuals who are continuesly improving, porting and extend the product.
Iometer – IOPS


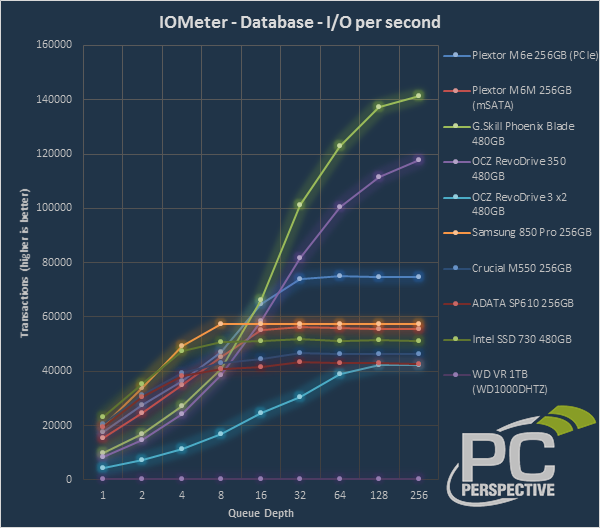

While the Phoenix Blade and RevoDrive do well at the high end of these tests, both are fighting a losing battle in random IO performance at the low end (QD<8). Most desktop usage sits in this lower part of the chart, and the less latent SATA controllers are able to reach maximum speeds in this window. The M6e sees the best of both worlds here to some extent. Latencies are very low, so the performance at lower queue depths is good, yet the added throughput capabilities of its 1GB/s PCIe link let it surpass the SATA units as they are hitting their interface bottlecks earlier on. Of particular note is the impressive random read performance shown in our Web Server workload.
Iometer – Average Transaction Time
For SSD reviews, HDD results are removed here as they throw the scale too far to tell any meaningful difference in the results. Queue depth has been reduced to 8 to further clarify the results (especially as typical consumer workloads rarely exceed QD=8). Some notes for interpreting results:
- Times measured at QD=1 can double as a value of seek time (in HDD terms, that is).
- A 'flatter' line means that drive will scale better and ramp up its IOPS when hit with multiple requests simultaneously, especially if that line falls lower than competing units.


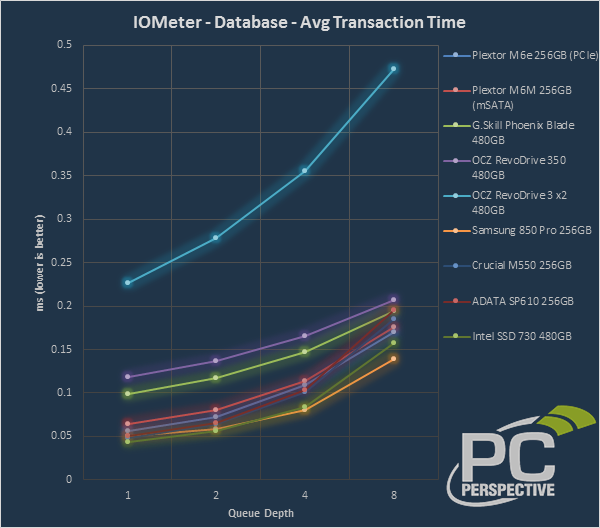

Impresively low latencies seen by the M6e here.
YAPT (random)
YAPT (yet another performance test) is a benchmark recommended by a pair of drive manufacturers and was incredibly difficult to locate as it hasn't been updated or used in quite some time. That doesn't make it irrelevant by any means though, as the benchmark is quite useful. It creates a test file of about 100 MB in size and runs both random and sequential read and write tests with it while changing the data I/O size in the process. The misaligned nature of this test exposes the read-modify-write performance of SSDs and Advanced Format HDDs.


The M6e sits high in the SATA pack on writes and easily surpasses all SATA devices on random reads here.


Allyn,
Would it be possible
Allyn,
Would it be possible to start running tests which would state how long it would take an OS to load, a game to load, photoshop to startup, etc.?
I ask because every time I read one of your reviews, I’m always saying to myself, “this looks good on paper, but how noticeable would this be compared to what i already have?”
It seems with ssds that it
It seems with ssds that it can be difficult to include a benchmark that truly charts or demonstrates a clear separation amongst models. Then you have to try to cover as many bases.
I have the same opinion. It doesn’t hurt to see more benchmarks. However, they have to have some meaning to them or it just becomes some random test to throw into a review.
The problem is that there are
The problem is that there are many other factors that do not involve the storage subsystem that contribute to these “tests”. “Did Photoshop take longer to load because the network was down” is just one example.
The relevant tests that would impact the tasks that you mentioned are mainly the sequential reads. Chances are you are not going to be able to perceive the fractions of seconds difference between most of these devices when starting Photoshop. Measuring this another challenge as well. The differences between many of these devices exist inside of the margin of error of human response time, so you cannot simply use a stopwatch.
What does matter is understanding the workloads that we run. This helps us to focus on the measurements that matter in a given scenario.
If I am doing database work I might care about the random writes, IOPS, and queue depth differences for example.
The commenters have it right
The commenters have it right here. There are other factors that limit OS boots and application launches. Boots tend to be swayed a lot (seconds), varying by different drivers / option ROM prompt screens of PCIe SSDs, etc. It's just not an apples to apples comparison there. When it comes to application loading, that varies not only by SSD choice, but by number of cores, RAM, etc.
That doesn't mean you can't roughly translate our tests to real world 'feel' of various apps. Probably the best of our tests for pure sequentials are HDTune and our file creation and copy tests. Those will tend to mimic the performance of anything performing bulk reads, like moving large files around, scrubbing large video files, some game loads, etc.
The heavy random IO tests (Iometer) will show how large amounts of parallel IO (higher QD) impacts performance. The lower queue depths (1-2) will show random performance of single-threaded apps. Games with a single thread handling level loads (very likely), that tend to access the game data randomly (varies from game to game), will tend to run at QD=1. This is where SandForce sees a disadvantage, due to high per-IO latency. Higher queue depths show how the SSD will perform during large amounts of parallel IO, such as heavily threaded applications, or multiple simultaneous application launches (windows boot, etc). Basically any time you'd hear a hard drive thrashing badly, that's when the IO's are really stacked up.
I do have some things in the works to better show performance related to specific applications, but it won't be an end-all answer, and will only supplement the other tests.
I have to agree with you.
I have to agree with you. Even though the tests might have some issues as identified by other commenters.
To have a rough idea in real world performance like loading OS, Photoshop, a game, or other. Seeing real performance is much easier for the general population to understand which is better. And it is easier for us to use these “examples” to guide our family/friends with regards to purchase
I agree with this too.
I agree with this too.
IOPS, sequential/random throughput is nice for synthetic benchmarks, but real world examples of performance is more of what consumers will understand.
For example, application and OS load times would help a consumer pick the appropriate SSD for the money.
If one SSD can load Windows in 15 seconds that costs $200, but another can do it in 16 seconds that costs $150 (assuming same storage capacity), then it makes sense to save $50.
Naturally, other features such as capacitors and integrated encryption should also be a consumer’s decision factor, but tangible, objective real world benchmarks are needed.
I like the other above see
I like the other above see all the read/write/mb’s, and say… will a couple of hundred dollars provide me a noticeable “kick seat of the pants” improvement to justify the cost?
While here’s my aversion to adopting one, do you take an existing install and transfer the OS and other things that makes great use of an SSD, while maintain the other folder and files on the HDD all pointing to the right place? Or is this something you’d be better to start with fresh install on the SSD and restore files to the HHD
I do a good amount of reading and hardware savvy, but the nitty-gritty of the inner workings of the OS and such has alway been something I’d rather not mess with.
Does anyone know of a guide or article that outlines the step’s to say install an SSD and cover what you would move/transfer and configure within the OS so files point to the proper drive when saving, updating etc. I’ve always thought it be great if you could install and SSD, then toss in a disc that prompts you to do this and that, for OS file to transfer automatically, indicate the drive hierarchy you then change to point to the files, etc. Perhaps I don’t know what I’m talking about… (ya-thunk), and making a mountain out of nothing, but I believe that like most it’s not a super simple thing to get set-up.
Have you forgotten about the
Have you forgotten about the Samsung XP941 – the obvious direct competitor?
bob Frost
Samsung has not sampled this
Samsung has not sampled this unit for review.
Just wanted to let everyone
Just wanted to let everyone know that I installed this card on my 5 year old Asus P7P55D LE which doesn’t have SATA3 ports. My previous boot drive was aSamsung 840, but on this mobo it’s been capped at around 250 MB/s according to CrystalDiskMark. With the Plextor M6e, I’m getting 622 MB/s! Nice upgrade for my old workstation.
HOWEVER, let me warn you all of a potential pitfall I ran into. My mobo has two x16 slots (I have no x2 slots and the rest are x1 – the Plextor needs x2 or you get half the throughput). However if there’s a video card plugged into the PRIMARY x16 slot (as there was) then the secondary slot on my mobo defaults to x1 mode. So when I ran my initial benchmarks, I got a very disappointing 350 MB/s. I had to read through the terrible English of my mobo manual to figure out what was wrong. I swapped the cards (put the Plextor in the primary slot, and the video in the secondary). This allowed the Plextor to run in x2, and the video card is running in x4 on the secondary, which is just fine as this is not my gaming system.
So bottom line is that this is a nice SSD upgrade for an older system that doesn’t have SATA3 ports – assuming you have a REAL x2 PCI-E slot (or better) available. Check your mobo documentation.