
Synthetic Benchmarks
The purpose of this article is to see how much the processor affects gaming, so there are a couple of ways to help identify variance from CPU to CPU. While a traditional chart arranged by highest score/average FPS is usually best, I decided to take a couple of different approaches here.
3DMark Fire Strike
As we get started you'll quickly notice that there's a lot of data to go through, so we'll first look at the results broken down by GPU. These are very long charts, so as you scroll down you should be on the lookout for performance variance between different CPUs paired with the same GPU.

Here are the same Fire Strike results without being filtered by GPU so you can see exactly how these 36 system configurations stacked up overall.
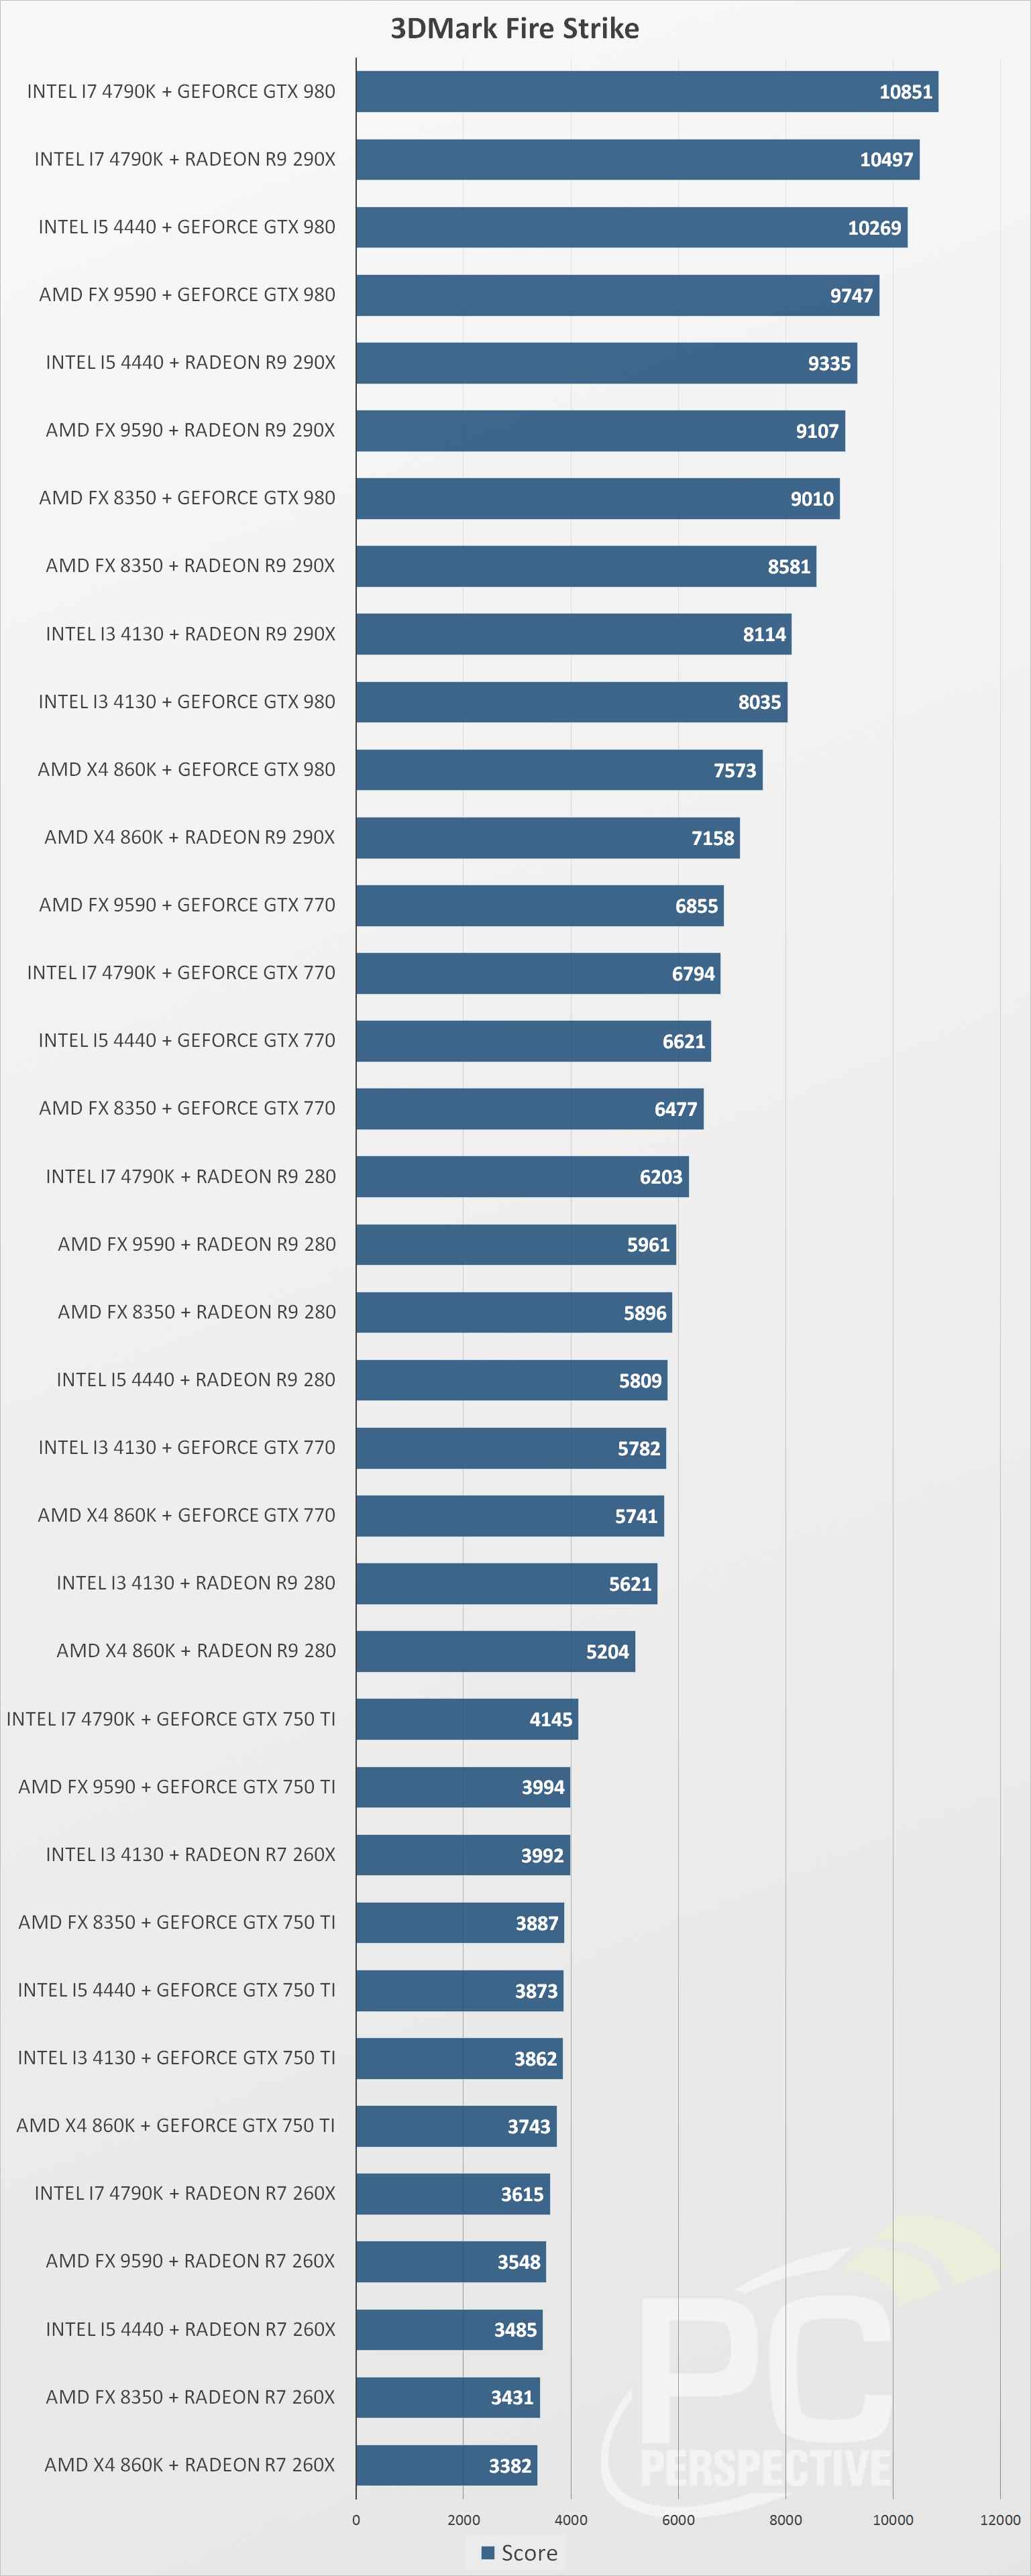
This benchmark represents an idealic situation for the hardware, with all components assisting with the final score. Scaling is pretty much as you might have guessed, with CPU power making an obvious difference in most cases. Real games won't have this advantage, but it's still interesting to get a baseline with these synthetic benchmark results.
3DMark Fire Strike Extreme
We'll look at the same sequence with the more intensive 3DMark Fire Strike Extreme benchmark, first with results sorted by GPU.

While the R9 290X results here are very predictable with the i7-4790K on top, take a look just below this at the GTX 980 results. Both the FX 9590 and FX 8350 from AMD provided better performance with the GTX 980 in this test, with the i7-4790K actually a few points behind the i5-4440! Given the difference in clock speed and thread count (8 vs. 4) one would think the i7-4790K would always best the Core i5. This happened again down at the R7 260X result, with the i3-4130 (a dual-core, HyperThreaded part) finishing so much higher that I can only assume something went wrong with this result. Sometimes benchmarks are odd.
And now we'll look at these results again, sorted by overall score:

Once again the GTX 980 wins out with AMD FX processors, and the i5-4440 edges out the i7-4790K for reasons unknown. The results with the R9 290X aren't far behind, but there is a steep drop from there to the GTX 770. The 770 has of course been superceded by not only the GTX 970, but the 960 as well, so its place here might be questioned. Still, it performs very well (essentially it is a GTX 680 with faster GDDR5) and outclasses the R9 280 in this test. An R9 285 would have been a better contender, but the low price of the 280 makes it a very attractive option.
Unigine Valley 1.0
Of the synthetic graphics benchmarks this is more of a "real-world" GPU test, and I've chosen to use the FPS numbers from these runs rather than the benchmark score.
Once again we start with the GPU-specific results, beginning with 1920×1080 results.

And overall:

Now the 2560×1440 results.


OMG … excellent review ….
OMG … excellent review …. !!!
i really hope and with u do the same for 2016 with DirectX12
i wanna ask question all
i wanna ask question all processor can use in laptop
pls i wanna know this
pls i wanna know this infomration about my proccesor laptop which proccesor i can use to replace with this proccesor
Description: Socket:
Description: Socket: FT3
Clockspeed: 1.4 GHz
No of Cores: 2
Max TDP: 15 W
Other names: AMD E1-2500 APU with Radeon(TM) HD Graphics
CPU First Seen on Charts: Q2 2013
Very nice post. I want to
Very nice post. I want to share what i bought a month ago and this setup is really working great, I regulary play GTA V, MECHWARRIOR ONLINE, DOTA 2, LEFT4DEAD, AFTERMATH, THE DIVISION, Second Life too 😀
And by stock everyone i play is at max settings full hd.
CPU: AMD FX 6300
GPU: GIGABYTE GTX 960 G1 4Gb
MB: MSI KRAIT EDITION 970A
HD 0: SAMSUNG EVO 850 250 Gb
HD 1: SEAGATE BARRACUDA 1Tb 7200rpm
MEM: 16Gb KINGSTONE HYPERX SAVAGE
POWER: MARS GAMING 700Wts
COOLER: MARS GAMING
BOX: MARS GAMING
FANS: MARS GAMING
KEYB AND MOUSE: MARS GAMING
SCREEN: ACER V226HQL ( 22″ )
900€ +-
Greetings.