
Performance Comparisons – Caching and SLC / TLC Write Speed
I've chosen to split the caching results off of the respective product pages in this review so that we can better compare them side-by-side on this page. First lets look at 750 EVO vs. 850 EVO at each capacity point:
120GB:


250GB:

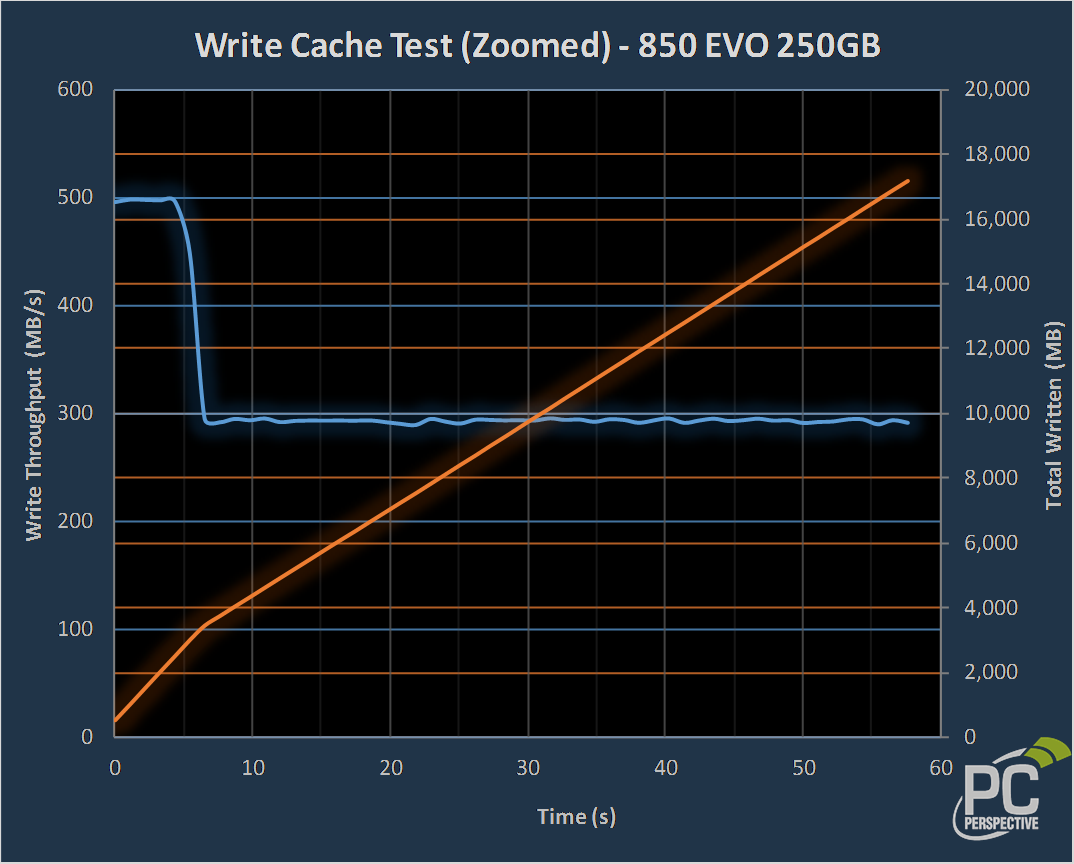
For the 120GB and 250GB capacities, the 750 and 850 EVO both carry the same 3GB SLC TurboWrite cache, but the 850's 3D VNAND has faster TLC write speeds than the planar NAND equipped 750 series products.
500GB:


An oddity noted here with the 500GB model of the 750 EVO – its SLC speed fell a bit shy of the 500 MB/s of its two smaller capacities. TLC speed kicks in at 6GB written and with it we see another 100 MB/s increase over the 250GB model, which is abnormally slow (we expect TLC speeds to double with a doubling in capacity). This effect does occur with the 850 EVO of the same capacity – that model's TLC speed doubles from the ~300 MB/s of its 250GB variant, shifting the bottleneck to its SATA interface, meaning there is no distinct transition between SLC and TLC during a sequential write workload.

MX300 enjoys a good sized cache as Micron's Dynamic Write Acceleration technology can flip sections of flash between SLC and TLC modes. Since this is dynamic, it is possible to see larger or smaller runs at SLC speeds, varying by percent fill and recent write activity.

The Intel 600p, despite being a fairly quick NVMe SSD with plenty of interface bandwidth, falls a bit flat once it has exhausted 16GB worth of continuous writing. The stuttery behavior seen once its cache is full boils down to Intel's chosen caching method, which is unable to write directly to TLC once the SLC has been filled. Sure you must write 16GB or more at >100 MB/s to reach the intermittent 30 MB/s activity seen above, but it is certainly something to note for the heavier users out there.


The SanDisk Ultra II and WD Blue show only minimal write caching (likely DRAM) during this test. The Blue is supposed to have an SLC cache, and it did show higher than 300 MB/s writes in our burst testing, but at the point in the sequence with the test sequence where this metric was checked (half full following a long period of idle time), it showed negligible caching during repeated checks.


On the page “Performance
On the page “Performance Focus – 750 EVO 250GB” under the first graph it says “Very impressive speeds for the 1TB 960 EVO. […]”.
Clearly that’s wrong 😀
Fixed. Thanks!
Fixed. Thanks!
You’re welcome 😉
You’re welcome 😉
Was Samsung 840 EVO really
Was Samsung 840 EVO really worth Editor’s Choice Award?
840 EVO? Back when it
840 EVO? Back when it launched? Sure. There were issues that were fixed, but could not be discovered at the time of the review.
hey Allyn, is it possible to
hey Allyn, is it possible to include some raid0 SATA devices on your chart? for example samsung 850 pro raid 0 or 960 pro raid 0 to see how it fairs with single drives.
I understand due to raid latency, QD1 performance would drop but since your chart shows average of 1-4QD this would see some improvement in terms of raid, also see how well does SSD caching with intel RST would benefit us over single drive.
Isn’t the 750 EVO EOL now?
Isn’t the 750 EVO EOL now?
I love your write up about
I love your write up about the Latency Percentile. Your storage reviews are by far more realistic with some real engineering behind it. Keep up the great work!
Still waiting on a Storage
Still waiting on a Storage Leader board, like have the stats of all of them on an consistently updated page.
The 500GB 750 Evo is $241,
The 500GB 750 Evo is $241, the 500GB 850 Evo is $170. You’d be a fool to buy the lesser 750 for more than the better 850.
You would be a fool to pay
You would be a fool to pay that, especially since you can get one practically anywhere for ~$145-155 depending on tax/shipping.
Hi Allyn.
Wishing you all a
Hi Allyn.
Wishing you all a happy festive season………………
Samsung and Sandisk(rip)were the only ones to get a grip
on planer TLC.That Ultra 2 result in the write cache test
is really strange.
I remember when you did a comparison a while back I asked
if you could include ultra 2 which was using folding on
each individual die-obviously you were too busy.
Guess something was going on in the background there…..
As to the 750 EVO’s-the 250 and 500 pass my requirements.
1.More than 8000 IOPS read QD1.(must for a boot drive)
2.Write more than 200MB after the cache(cant have it slower
than my spinning rust)
Would be great if this huge
Would be great if this huge chart was searchable and not as an image. I wonder if my Toshiba Toshiba THNSNJ is somewhere there…